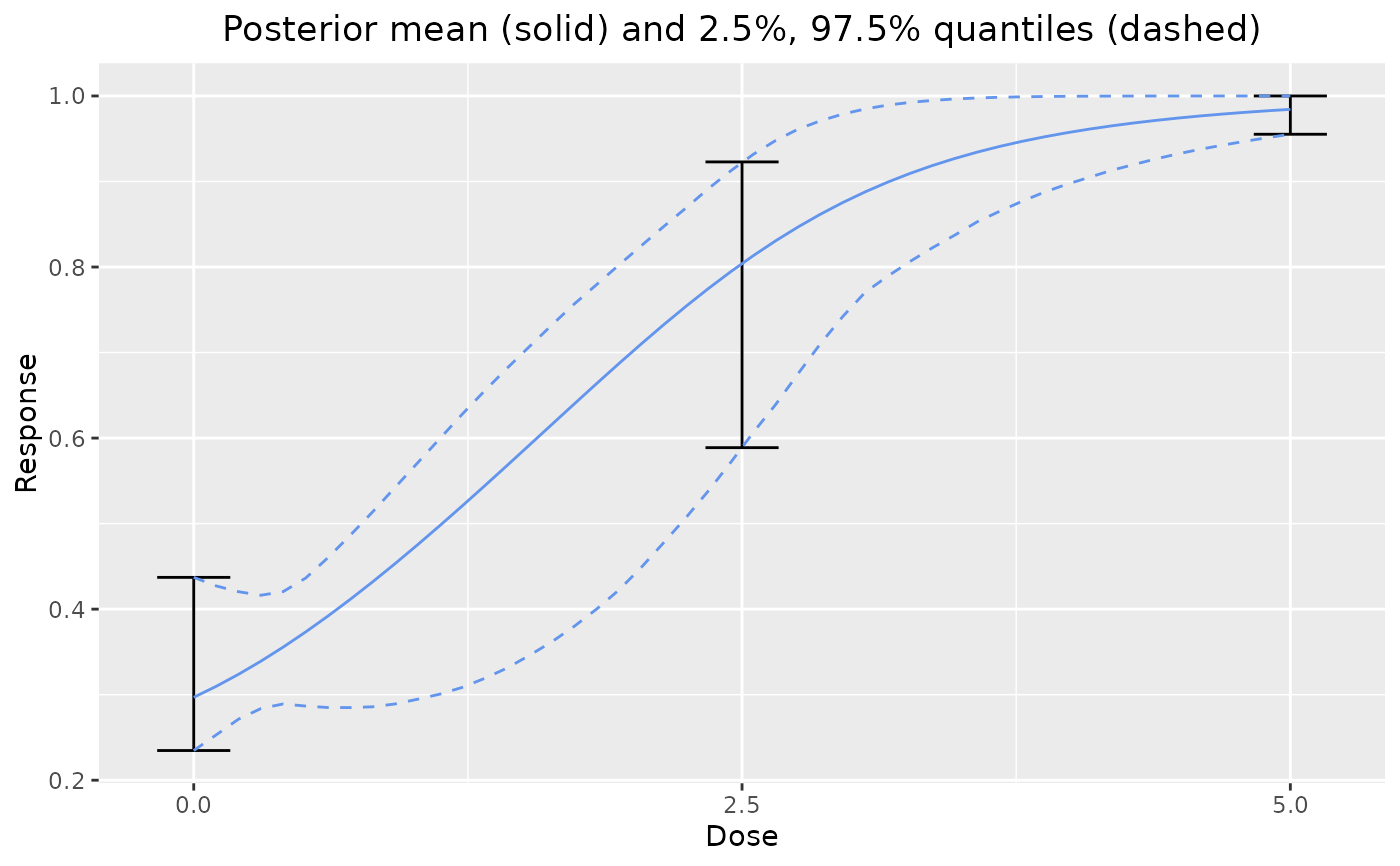
Plot the prior over the dose range. This is intended to help the user choose appropriate priors.
dreamer_plot_prior(
  n_samples = 10000,
  probs = c(0.025, 0.975),
  doses,
  n_chains = 1,
  ...,
  times = NULL,
  plot_draws = FALSE,
  alpha = 0.2
)
Arguments
- n_samples
the number of MCMC samples per MCMC chain used to generate the plot.
- probs
A vector of length 2 indicating the lower and upper percentiles to plot. Not applicable when
plot_draws = TRUE.- doses
a vector of doses at which to evaluate and interpolate between.
- n_chains
the number of MCMC chains.
- ...
model objects. See
modeland examples below.- times
a vector of times at which to plot the prior.
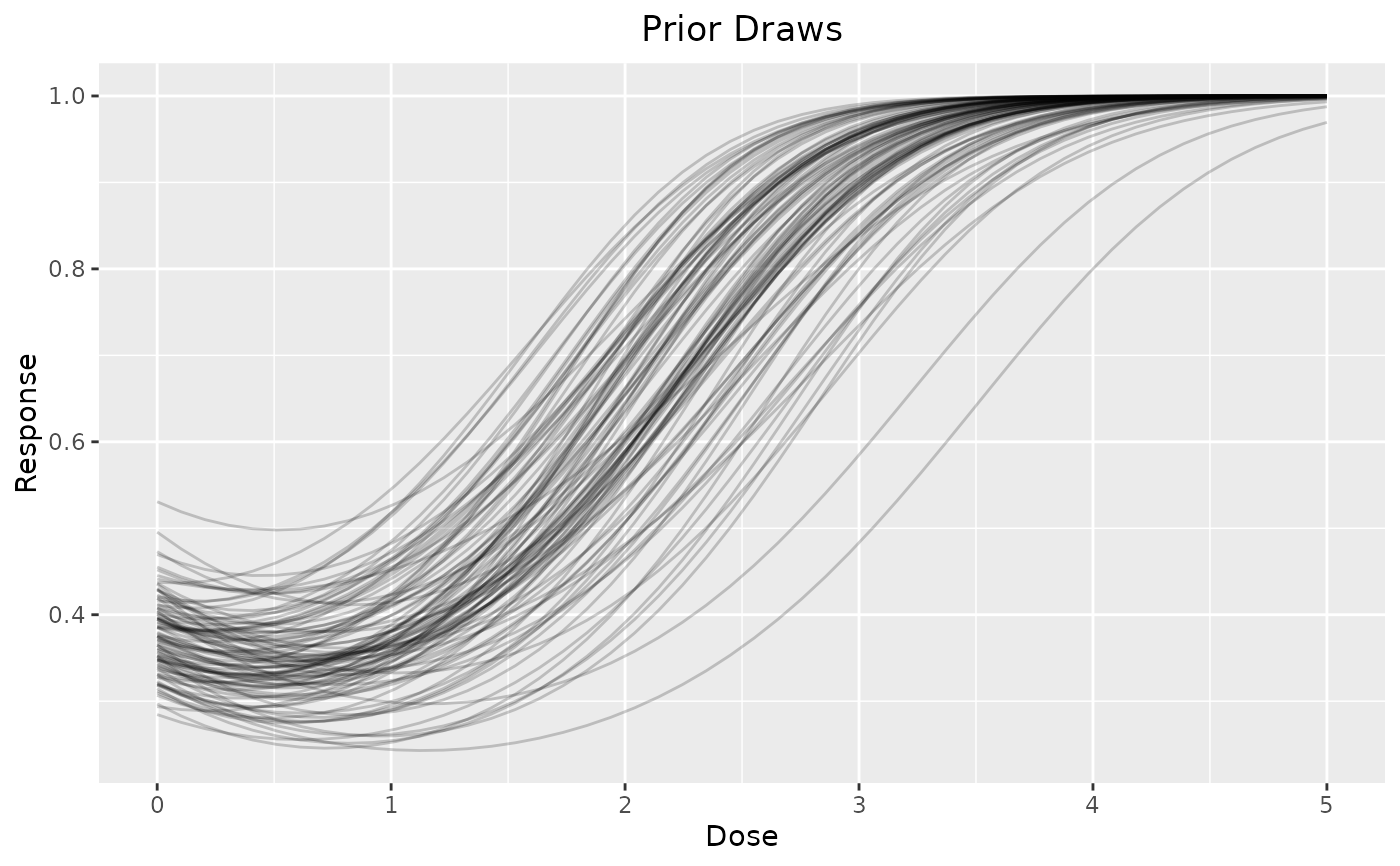
- plot_draws
if
TRUE, the individual draws from the prior are plotted. IfFALSE, only the prior mean and quantiles are drawn.- alpha
the transparency setting for the prior draws in (0, 1]. Only applies if
plot_draws = TRUE.
Value
The ggplot object.
Examples
# Plot prior for one model
set.seed(8111)
dreamer_plot_prior(
doses = c(0, 2.5, 5),
mod_quad_binary = model_quad_binary(
mu_b1 = -.5,
sigma_b1 = .2,
mu_b2 = -.5,
sigma_b2 = .2,
mu_b3 = .5,
sigma_b3 = .1,
link = "logit",
w_prior = 1
)
)
 # plot individual draws
dreamer_plot_prior(
doses = seq(from = 0, to = 5, length.out = 50),
n_samples = 100,
plot_draws = TRUE,
mod_quad_binary = model_quad_binary(
mu_b1 = -.5,
sigma_b1 = .2,
mu_b2 = -.5,
sigma_b2 = .2,
mu_b3 = .5,
sigma_b3 = .1,
link = "logit",
w_prior = 1
)
)
# plot individual draws
dreamer_plot_prior(
doses = seq(from = 0, to = 5, length.out = 50),
n_samples = 100,
plot_draws = TRUE,
mod_quad_binary = model_quad_binary(
mu_b1 = -.5,
sigma_b1 = .2,
mu_b2 = -.5,
sigma_b2 = .2,
mu_b3 = .5,
sigma_b3 = .1,
link = "logit",
w_prior = 1
)
)
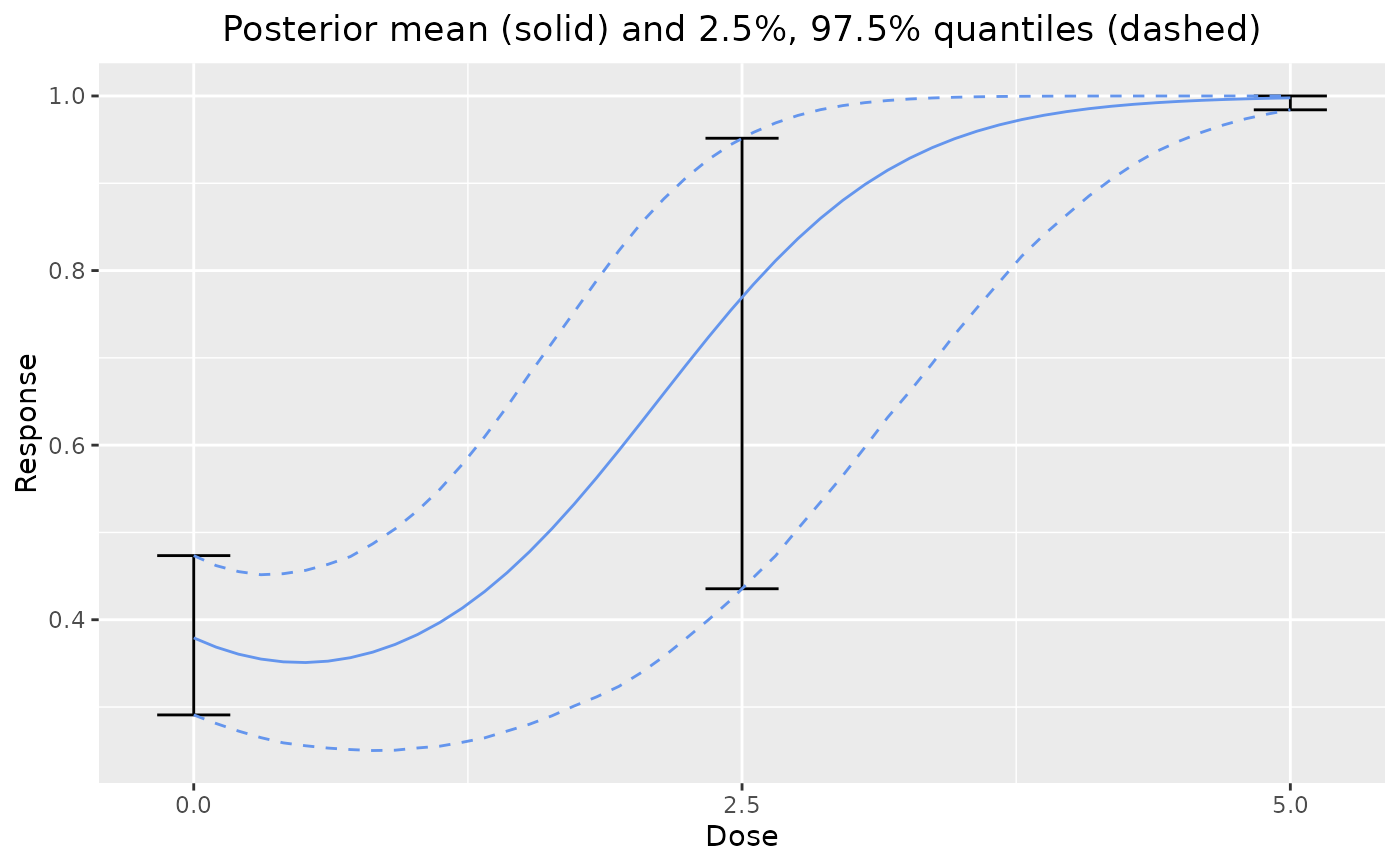
 # plot prior from mixture of models
dreamer_plot_prior(
doses = c(0, 2.5, 5),
mod_linear_binary = model_linear_binary(
mu_b1 = -1,
sigma_b1 = .1,
mu_b2 = 1,
sigma_b2 = .1,
link = "logit",
w_prior = .75
),
mod_quad_binary = model_quad_binary(
mu_b1 = -.5,
sigma_b1 = .2,
mu_b2 = -.5,
sigma_b2 = .2,
mu_b3 = .5,
sigma_b3 = .1,
link = "logit",
w_prior = .25
)
)
# plot prior from mixture of models
dreamer_plot_prior(
doses = c(0, 2.5, 5),
mod_linear_binary = model_linear_binary(
mu_b1 = -1,
sigma_b1 = .1,
mu_b2 = 1,
sigma_b2 = .1,
link = "logit",
w_prior = .75
),
mod_quad_binary = model_quad_binary(
mu_b1 = -.5,
sigma_b1 = .2,
mu_b2 = -.5,
sigma_b2 = .2,
mu_b3 = .5,
sigma_b3 = .1,
link = "logit",
w_prior = .25
)
)